A WellnessPulse analysis of 50 best-selling protein bars sold by popular retailer chains across the U.S. found that only 66% contain enough of the nutrient to be considered ‘high protein.’ Moreover, many bars are high in sugar and low in fiber, raising questions about whether they can be considered ‘healthy’ food options.
As many as 71% of Americans said they were trying to consume more protein, according to a 2024 survey.
This may reflect a common perception that a higher protein content signals a ‘healthier’ or ‘more natural’ product, with nutrition claims like ‘high protein’ on labels potentially increasing consumer willingness to purchase it.
But do these claims always deliver what they promise? To find out, a WellnessPulse nutrition expert analyzed 50 best-selling protein bars sold at Walmart, Target, and Amazon online stores.
She evaluated the products' protein content and quality and examined other ingredients like sweeteners and flavors.
You can find the full methodology here.
The analysis reveals that only 66% of protein bars meet the ‘high protein’ claim criteria. Having a high protein content doesn't appear to ensure its potential quality — just over half (58%) of bars could be considered to likely provide high-quality protein, according to the analysis.
Furthermore, less than half (48%) of the bars included in the analysis are high in fiber, and only 28% are low in total sugar, indicating that protein bars should not replace balanced meals.
Analysis of protein, fiber, and sugar content
Below, you can find the WellnessPulse analysis of 50 protein bars regarding their protein, fiber, and sugar content.
Protein content
Of the protein bars analyzed, 66% (33 products) meet the ‘high protein’ claim criteria. This means two-thirds of protein bars contain 20% or more of the daily protein value (DV) per Reference Amounts Customarily Consumed (RACC).
RACC refers to the amounts of food and drinks typically consumed in one sitting and is defined by U.S. food regulatory agencies such as the Food and Drug Administration (FDA).
The recommended daily protein intake for most people who are minimally physically active is 0.8 g of protein per kilogram of body weight or 0.36 g per pound. For a person who weighs 70 kg (154 lbs), the daily protein requirement amounts to 56 g. However, those who exercise regularly may have higher protein needs.
Fiber content
Nearly half — 48% of protein bars (24 products) — included in the WellnessPulse analysis can be considered high in fiber, as they contain 20% or more of the DV per RACC.
Dietary fiber meaningfully contributes to overall well-being by supporting gut and heart health. An adult on a standard 2,000 kcal diet needs around 28 g of fiber each day. However, most Americans consume only half of the recommended fiber.
As high-protein bars may be lacking in fiber, it is crucial to consume other fiber-rich foods like vegetables, fruits, whole grains, and legumes.
Sugar content
Only 28% (14 products) of high protein bars analyzed by WellnessPulse met the criteria of being ‘low sugar,’ meaning that they have no more than 5 g of sugars per 100 g of product.
Individuals who need to lower their sugar intake must be especially careful when reading labels, as some foods disguised as potentially healthy may be surprisingly high in sugar.
No more than 6% of daily calories should come from added sugars, according to the American Heart Association (AHA). However, we also consume naturally occurring sugars in more nutrient-dense foods like fruits and vegetables.
It’s noteworthy that the analysis looked into the total sugar content rather than added sugar only.
Analysis of protein sources and their quality
Protein sources and their quality may significantly impact how our bodies absorb and digest this vital nutrient. The WellnessPulse researcher looked into what types of protein sources are used in the 50 best-selling bars and what their potential quality scores are.
Protein sources
Bars often use multiple protein sources, such as dairy and plant-based protein combinations. This can be done to enhance the amino acid profile or cater to various dietary needs.
According to the WellnessPulse analysis, the majority of the 50 best-selling bars contain animal protein: 30% use purely animal-based protein, and 32% contain a blend of plant-based and animal-based protein.
Purely plant-based protein is found in nearly one in four (38%) bars analyzed by WellnessPulse, potentially indicating the increasing interest in vegan protein sources.
Whey protein isolate or concentrate is the most common protein source in the analyzed bars, used in 78% of samples.
As many as 36% of bars included in the analysis contain plant-based soy protein isolate, making it the second most common protein source.
It is followed by milk protein isolate or concentrate, which is detected in 34% of samples.
One-fifth (20%) of protein bars analyzed contain pea protein, and 16% contain casein, a protein found in milk that gives it its white color.
The findings reflect a general trend that dairy-based protein bars dominate the market.
Apart from pea protein, most of these sources could be considered common allergens.
Some 1.9% of American adults report milk allergy, with rates even higher among children, while soybean allergy may affect 0.7% of adults in the U.S.
Protein quality
When it comes to protein, quantity is important, but what also matters is its quality, which can be assessed using a scientific method called PDCAAS, short for protein digestibility–corrected amino acid score.
High-quality protein usually means that the protein source contains all nine essential amino acids in the right proportions. Such protein is also highly digestible, meaning the body can absorb and use the amino acids from the protein efficiently.
Of the 50 bars analyzed, 58% could be considered to provide potentially high-quality protein, with a PDCASS score of 0.9 or higher.
Surprisingly, nearly half of the bars may lack quality protein: 22% have a potentially moderate protein quality score, and 20% score likely to be of low quality.
Using a blend containing multiple lower-quality protein sources and only a single high-quality protein source may affect the PDCAAS score. For example, protein bars intended for vegans and vegetarians might have provided only plant-based sources of proteins and didn’t contain protein sources scoring higher for PDCAAS, such as soy or pea proteins.
Moreover, nine out of 45 protein bars contain collagen, which tends to increase the amount of protein in grams per serving but likely reduces the total PDCAAS score.
Analysis of sweeteners and flavors
Sweeteners and flavors are added to foods to enhance their taste and smell. The analysis looked into whether natural versions of these ingredients dominate the analyzed protein bars.
Sweeteners
Sweeteners are often used in foods and drinks to help reduce the intake of sugar, which, when consumed in excess, is associated with tooth decay and weight gain, among other concerns.
Nevertheless, simple table sugar is the most common sweetener found within ingredients in 72% of protein bars analyzed, according to the analysis.
Artificial sweeteners are those that cannot be found in nature and are synthetically produced. In contrast, all sweeteners derived from natural sources are considered natural, regardless of how highly refined and processed they might be, according to the FDA.
Artificial sweeteners maltitol and sucralose are used in 26% and 22% of the analyzed bars, respectively.
Natural sweeteners also have their place in protein bars. For example, tapioca syrup is found in 18% of the products analyzed, while 16% of the bars contain stevia.
An artificial sweetener, erythritol, which can be synthesized from corn, is used in 16% of the protein bars.
Overall, more than half (58%) of protein bars analyzed contain only natural sweeteners, 14% contain only artificial sweeteners, and 28% use blends of both.
Frequent use of table sugar alongside other sweeteners like stevia could presuppose that manufacturers may use blends to reduce the added sugar content on the label.
Flavors
As many as 86.4% of the protein bars contain only natural flavors, as opposed to 2.3% with artificial flavors only. Blends of both natural and artificial flavors are used in 11.3% of the protein bars analyzed.
Natural flavors are those derived from foods like fruits and herbs, while artificial flavors are made from synthetic agents.
Although the FDA strictly regulates artificial flavors, some studies suggest their use may negatively impact health in the long term. However, more rigorous scientific studies are needed to understand their impact.
Analysis of an average protein bar
As protein bars selected for the analysis vary in serving sizes, their nutritional values were standardized to an average calculated serving size of 50 g to enable direct comparison.
The nutritional value of the average protein bar was calculated and compared against the Dietary Guidelines for Americans (DGA).
The average 50 g protein bar contains 200 kcal, which is one-tenth of the calories in a standard 2,000 kcal diet.
Such a protein bar contains 8 g of total fat, equal to 10% of the recommended daily value (DV). The total fat intake includes 3 g of saturated fat, which is around 15% of the DV.
According to the DGA, about 20–35% of daily energy should come from monounsaturated or polyunsaturated fats, which is 44–78 g per 2,000 kcal diet. Meanwhile, saturated fat should be limited to no more than 10% of daily caloric intake or 22 g per 2,000 kcal diet.
The saturated fat content in the average protein bar is modest. However, including them as snacks in a diet already high in saturated fat-rich foods like sausages and cakes can quickly add to the total daily intake of saturated fats.
The average protein bar contains 139 mg of sodium, which constitutes around 6% of the recommended DV. The daily sodium intake should not exceed 2,300 mg, according to the DGA.
Of the 20 g of carbohydrates in the average protein bar, 5 g is dietary fiber, accounting for 18% of the DV, meaningfully contributing to the daily intake, especially in a balanced and varied dietary pattern.
In a 2,000 kcal diet, 45–65% of daily calories should come from carbohydrates, with the recommended amount of 225–325 g. The DGA recommends consuming 14 g of dietary fiber per 1,000 kcal daily. This means a person on a standard diet should consume 28 g of fiber each day.
The average protein bar has 4 g of added sugars or 8% of the recommended DV. No more than 10% of calories should come from added sugar, according to the DGA, equal to no more than 50 g or 12.5 teaspoons.
With a protein content of 15 g, the average protein bar can provide 30% of the DV, greatly contributing to the daily intake. The guidelines recommend that most people get 10–35% of daily calories from protein. In a standard 2,000 kcal diet, this would equal 50–175 g of protein per day.
Such a protein bar contains 80 mg of calcium, equal to 6% of the DV. Adults need about 1,000 mg of calcium daily, according to the DGA.
The potassium content of 138 mg in the average protein bar constitutes 3% of the DV. The DGA recommends that adult women consume 2,600 mg and men 3,400 mg of potassium a day.
The average protein bar contains 1.4 mg of iron, accounting for 8% of the DV. As per DGA, women need 18 mg of iron each day, while men need 8 mg.
The average protein bar has no dietary cholesterol and trans fat.
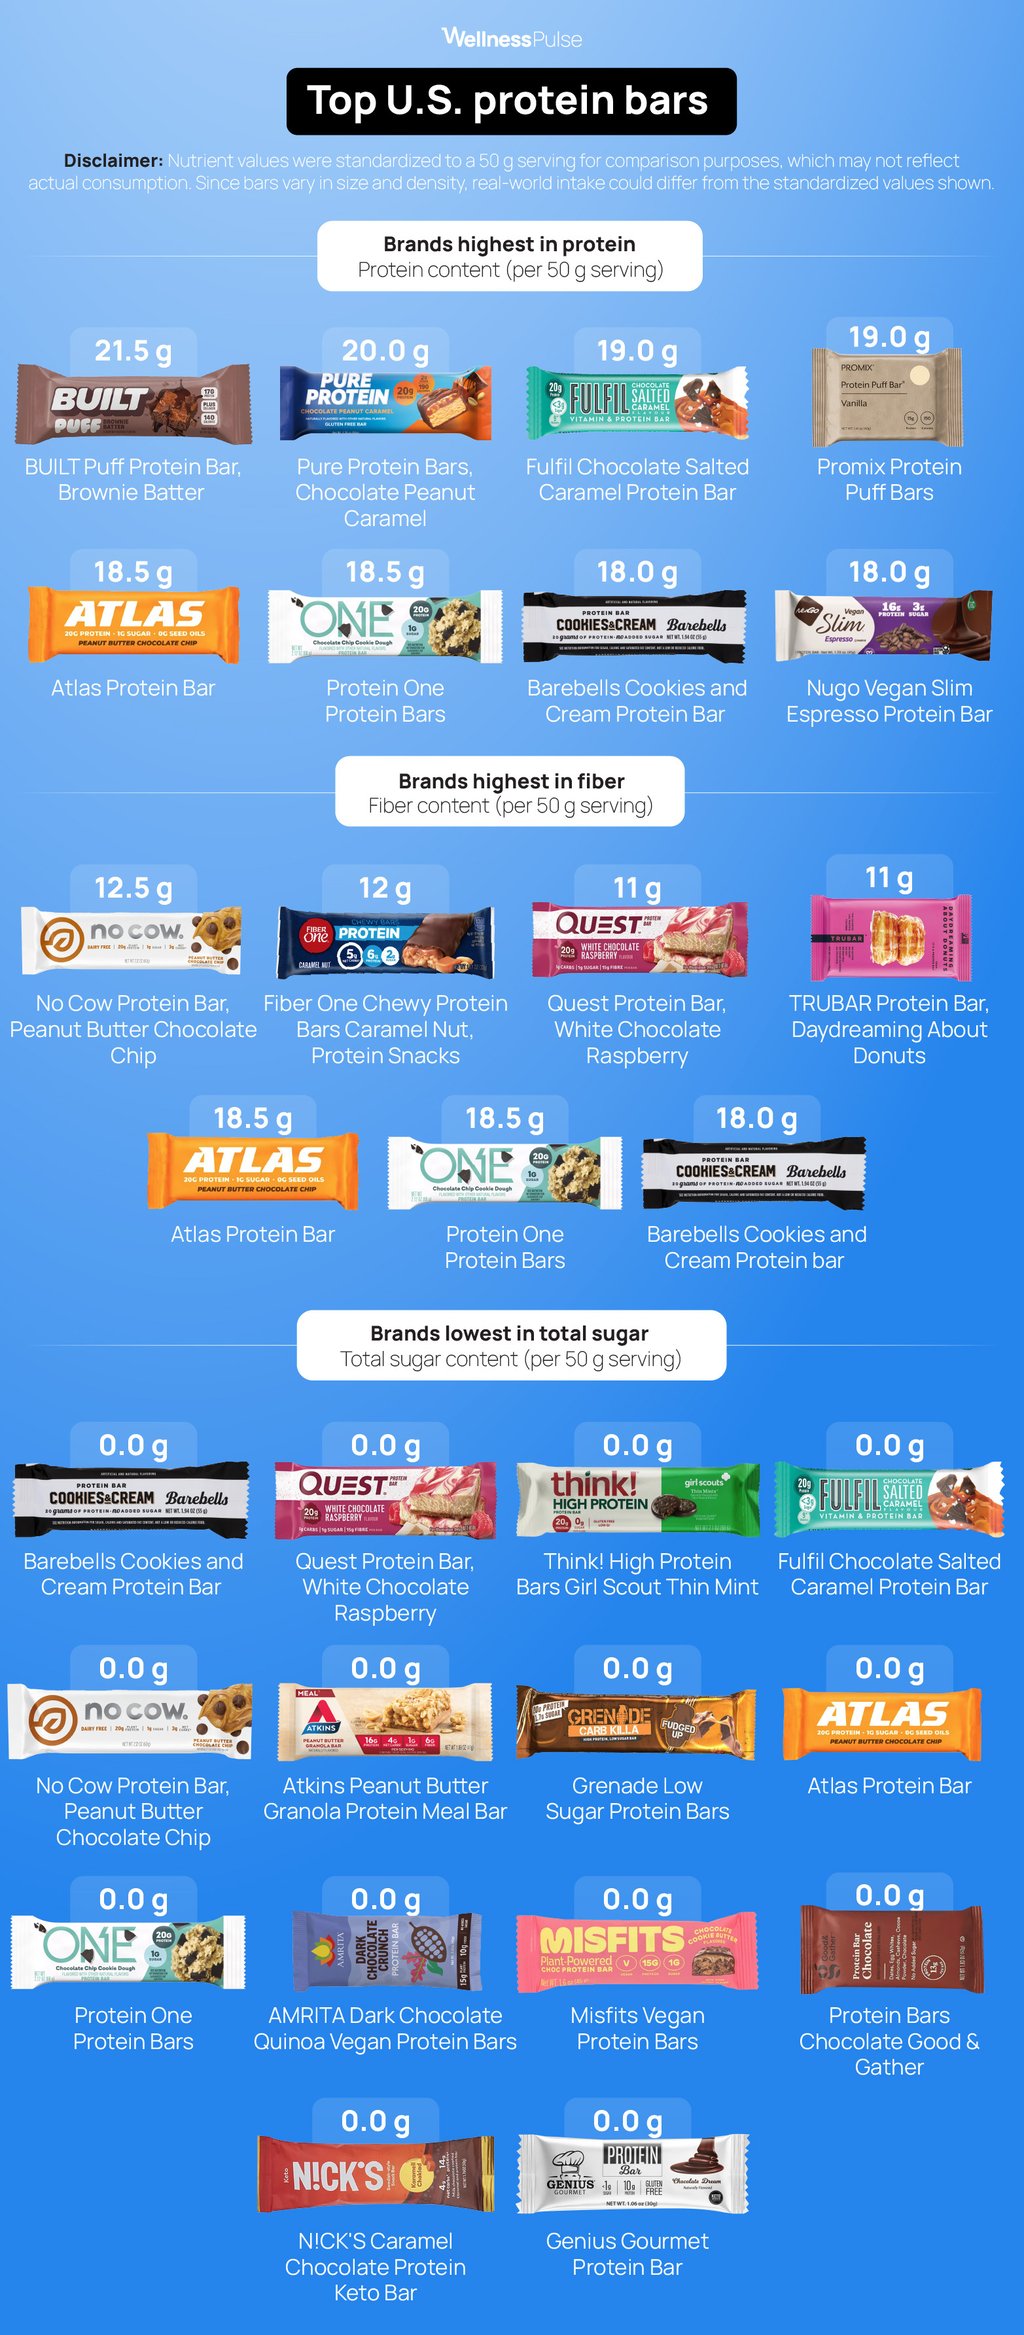
The ranking: desirable characteristic
Below, you can find protein bars that are highest in protein and fiber per 50 g serving and can meaningfully contribute to the recommended daily intakes of these nutrients. Moreover, the protein bars listed in the infographic below contain no sugar, making them a great choice for those who try to limit their sugar intake.
The ranking: undesirable characteristics
Below, you can find the list of bars that are lowest in protein, containing 6.5–11 g of protein per 50 g serving. Moreover, two bars contain no fiber at all, while three contain as little as 1 g, putting them in the lowest-fiber category.
The highest-sugar protein bars contain between 10 to 18 g of sugar per 50 serving. Consuming these bars would provide about half of the recommended daily added sugar intake, which is no more than 25 g for women and 36 g for men.

The ranking: highest and lowest calorie protein bars
Of the 50 protein bars included in the WellnessPulse analysis, six fall under the highest-calorie category, as they contain between 250 and 291 kcal per 50 g serving. In a standard 2,000 kcal diet, consuming these bars could quickly add up to the upper-calorie limit.
Meanwhile, the lowest-calorie protein bars contain 159–175 kcal per 50 g serving, making them a better snack option. However, calorie content shouldn't be the only criterion when choosing protein bars — it's also important to consider protein and its quality, fiber, and sugar content.

Findings overview
Although protein bars may be marketed as a ‘healthy’ snack option, the WellnessPulse analysis indicates that many may lack high-quality protein and fiber while being high in sugar.
Only 66% of the bars included in the analysis have sufficient protein content to meet the ‘high protein’ claim criteria. Even fewer — 58% — can be considered as providing high-quality protein.
As simple table sugar is the most common sweetener used in 72% of the bars analyzed, it comes as no surprise that only 28% of the products meet the criteria of being ‘low sugar.’
The findings may suggest the increasing interest in vegan foods, as 30% of the bars contain purely plant-based protein.
Methodology
Below, you can find more detailed information about how the protein bars were selected and the analysis methods.
Sample collection
WellnessPulse researcher Sandra Vigelienė collected the sample protein bars between March 4, 2025, and March 12, 2025, from three widely accessible supermarkets: Walmart, Target, and Amazon.
These retailers were chosen for their comprehensive online platforms, which allowed for the easy identification of protein bars and access to complete nutritional and ingredient labels.
The most commonly purchased protein bars in the U.S. market were identified by using filters ‘top brands’ and/or ‘best sellers.’
A total of 50 bars explicitly identifying themselves as ‘protein bars’ on their packaging or in the product name were selected for the research. Other products that made 'high in protein' claims but were not clearly marketed as protein bars were excluded.
Of the 50 protein bars selected, 70% were sourced from the supermarkets' ‘best seller’ and/or ‘top brands’ categories, while the remaining 30% were chosen randomly.
This methodology was designed to ensure that the analysis reflected both the most popular and widely recognized protein bars, aligning with current market trends, and also captured a range of lesser-known or emerging products.
Serving size, calories, macronutrient content, and available listed micronutrient content information were collected from the available nutritional label of each protein bar.
Additionally, ingredient information of each protein bar for the entire sample of bars was collected, including main protein sources, sweeteners, sugar sources, colors, and flavors (if provided by the manufacturer).
The sample was continuously screened to prevent the repetition of protein bars collected across different supermarkets. Different flavor bars from the same brands were generally disregarded, except in cases where those bars provided meaningfully different nutritional values and ingredients.
Data analysis
The researcher summarized the ingredients and nutritional information of protein bars. When manufacturers reported nutrient values with a ‘less than’ sign (<), the reported value was adjusted to 50% of the value provided for consistency.
Each bar's protein content was compared to the U.S. nutrition claims for ‘source of protein’ and ‘high in protein’ criteria. This allowed us to determine how many bars meet the criteria and provide adequate amounts of protein per serving. Fiber content and total sugar content were analyzed similarly.
Moreover, protein quality was assessed using the protein digestibility-corrected amino acid score (PDCAAS). The common PDCAAS scores for protein sources were collected from various scientific literature sources and authoritative websites.
When multiple protein sources were present, an equal distribution of those sources within the protein bar formulations was assumed due to a lack of precise formulation data. Based on total PDCAAS scores, protein bars were classified into three categories:
| Likely high protein quality | Likely moderate protein quality | Likely low protein quality |
| PDCAAS ≥ 0.90 | 0.7 ≤ PDCAAS ≤ 0.89 | PDCAAS < 0.70 |
Such distribution was selected based on the FAO classification assessments of protein quality in terms of the PDCAAS score.
In terms of nutritional values, the highest- and lowest-ranking protein bars in key categories (calories, fiber, protein, and added sugar) were identified, and the top five brands selected to be represented in the results.
For ingredient analysis, the distribution and the types of protein sources were assessed. Protein sources were categorized based on their natural origin as likely animal-based, likely plant-based, or blended, which included both animal and plant-based sources. This allowed the identification of the most commonly used protein sources.
Similarly, each bar's sweetener and flavor profile was analyzed, classifying them as containing natural, artificial, or blended sweeteners, with the most frequent sweetener types highlighted.
Regarding flavors, the brands tend not to disclose the particular flavor ingredients, both in terms of natural and artificial flavors. Six protein bars were excluded from the overall flavor distribution analysis because they didn't disclose this information.
In terms of sweeteners and flavors distribution within the categories' ‘Likely natural,’ ‘Likely artificial,’ or ‘Blends,’ each of the sweeteners and flavor sources was evaluated based on the FDA definitions for natural and artificial additives.
Average protein bar
Due to variations in serving sizes, all nutritional values were standardized to an average calculated serving size of 50 grams to enable direct comparison. Following this adjustment, key nutritional trends, including calories, protein, fiber, sodium, saturated fats, and added sugars, were analyzed.
Additional nutrients, such as total fat, cholesterol, total carbohydrates, sugar alcohols, and key vitamins and minerals, were also assessed.
Based on the average findings of macro- and micronutrients, an estimated ‘Average American Protein Bar’ was drafted and compared against the Dietary Guidelines for Americans.
Additionally, the sample of 50 protein bars and the estimated ‘Average American Protein Bar’ were assessed against U.S. nutrition claim criteria for ‘high’ and ‘source of/good source of’ protein and fiber.
Limitations and bias
Multiple limitations and biases of the analysis may have an impact on how the findings are interpreted and applied.
- Serving size standardization. This limitation was particularly important in rankings of protein bars according to their key nutrients. Standardizing all nutritional values to a 50-gram serving size allows direct comparisons but may not accurately reflect real-world consumption patterns. Some protein bars are typically consumed in their entirety, regardless of their actual weight, meaning their true nutrient intake may differ from the standardized values used in the analysis. Additionally, calorie and protein density variations among bars could lead to discrepancies between the standardized values and what consumers actually ingest, potentially affecting the interpretation of nutritional trends.
- Protein quality assessment. The assumption of equal distribution among multiple protein sources may not accurately reflect the actual formulation of each protein bar. Additionally, PDCAAS values can vary based on processing methods and ingredient interactions, which were not accounted for in this analysis. As a result, the estimated protein quality classifications do not reflect the actual quality in terms of digestibility and bioavailability of protein in each bar. Such analysis should be treated as general insights and tendencies that may be present within the particular sample.
- Selection bias. The exclusion of bars that do not explicitly identify as ‘protein bars’ or that only make general protein claims may have resulted in the underrepresentation of certain products that could still be relevant to the analysis.
16 resources
- Food Insight. 2024 IFIC Food & Health Survey.
- Applied Sciences. The source of protein or its value? Consumer perception regarding the importance of meat(-like) product attributes.
- Food & Function. Dietary protein intake and human health.
- Encyclopedia of Food and Health. Casein and caseinate: methods of manufacture.
- National Institutes of Health. Health benefits of dietary fibers vary.
- StatPearls. High fiber diet.
- Food Quality and Preference. Truthful yet misleading: consumer response to ‘low fat’ food with high sugar content.
- American Heart Association. Added sugars.
- Advances in Nutrition. Sugars and dental caries: evidence for setting a recommended threshold for intake.
- CDC. Get the facts: added sugars.
- JAMA Network Open. Prevalence and severity of food allergies among US adults.
- The Journal of Nutrition. The protein digestibility–corrected amino acid score.
- FDA. Food ingredients & colors.
- Dietary Guidelines for Americans. Dietary Guidelines for Americans 2020-2025.
- Food and Agriculture Organization. Dietary protein quality evaluation in human nutrition.
- ACS Symposium Series. Introduction to flavor and fragrance in food processing.


Your email will not be published. All fields are required.